


Private investment has been steadily flowing into the communications and networking space for more than a decade, driven in large part by the telecommunications subsector and broadband service providers. Macroeconomic challenges—including geopolitical tensions, global supply chain disruptions, and interest rates raised to combat inflation—emerged in early 2022, ushering in a new normal for dealmaking that continues to cause trends to shift.
The regulatory environment and capital-intensive nature of telecommunications providers add additional hurdles for dealmakers. Annual private investment values have declined moderately since 2020, reflecting a relatively conservative approach to deal-making.
However, pockets of opportunity remain.
Explore current market conditions and transaction trends in this follow-on to our Broadband Industry Market and Transaction Trends Report.
Q1 2023 Overview
Quarterly private investment deal value grew 41.6% in the first quarter of 2023 and already represents more than half of the annual total closed in 2022. After a period of uncertainty, investors are accepting longer-term volatility and pursuing deals to put capital to work in the down market. The continued growth of digital and mobile technologies including 5G and cloud-based communication tools is driving significant private market investment.
M&A, which drives most deal value in the space between strategic transactions and buyouts, started the year off strong, with more than $50 billion closed year-to-date (YTD). Private equity (PE) deal activity reached a near-record high in 2022 and maintained momentum in early 2023. Venture capital (VC) activity in the space notched its highest level in 2022, performing stronger than many other industries.
Industry Trends
Deployment of fiber optic networks and 5G technology remains a top priority for service providers around the world.
As penetration remains low in certain markets including the United States, opportunities for returns exist in 5G deployment. The need for low-latency data processing will grow alongside high-speed internet adoption. PE firms and buyers can drive value by investing in large-scale infrastructure projects aimed at expanding access to these technologies. End-user demand for next-generation connectivity and devices remains high.
Gartner predicts that 60% of enterprises worldwide will simultaneously use at least five wireless technologies by 2025. The significant level of operational dependency on wireless technology will drive continued investment and competition in the space.
Cybersecurity needs are expanding in lockstep with communications technology. Data breaches and cyberthreats are more common and effective, underscoring the need for greater and continuously updated cybersecurity investment.
Competition is intense and growing, which contributes to greater consolidation as companies seek to gain market share and expand their capabilities. Regulators closely monitor the industry—in particular, telecommunications providers such as Sprint and T-Mobile, whose merger in 2020 required a two-year approval process and reduced the number of top wireless carriers in the United States to three.
Federal oversight of broadband through the Federal Communications Commission (FCC) and both state and federal regulation of internet service providers (ISPs) creates high barriers to entry for service providers.
Federal funding can support investment opportunities in certain markets. China, South Korea, Japan, the United States, and the European Union all identified 5G as a strategic technology and provide some form of regulatory support or funding for R&D.
North America and Europe historically drive most global activity in the industry, a trend that continued YTD. In the United States, recent efforts to bolster infrastructure include the Infrastructure Investment and Jobs Act of 2021. This legislation established the Broadband Equity, Access, and Deployment (BEAD) Program, which will direct $42.5 billion in state grants to expand high-speed internet access.
Trends at a Glance
- Market volatility and hesitant dealmaking define 2022. Many investors chose to wait out the initial disruptions, but as the year went on it became clear that negative economic conditions were a longer-term challenge.
- Firms sat on a record level of dry powder in 2022 due to healthy exit returns in 2021. The fundraising environment is no longer as plentiful, but firms retain material purchasing power.
- Communications and networking M&A volume hit record highs in the mid-2010s and maintained a steady flow of dealmaking since. Activity slowed in 2022 but grew quickly in the first quarter of 2023.
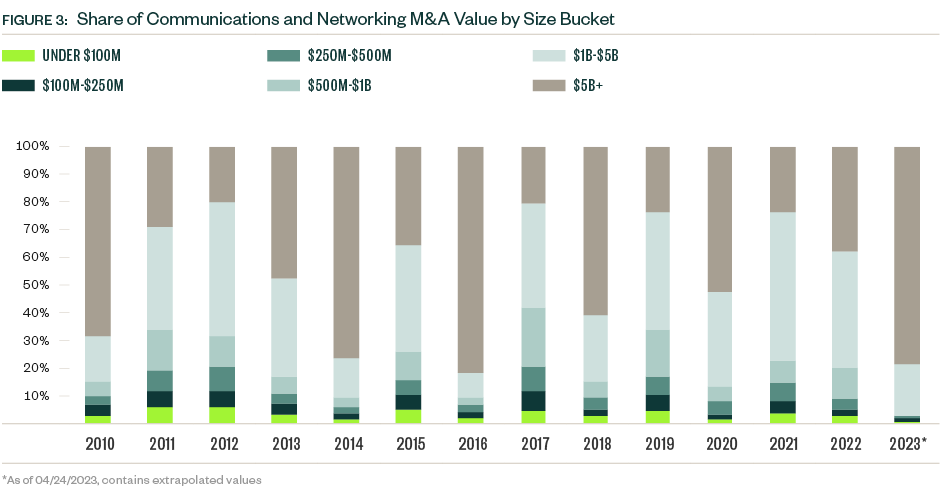
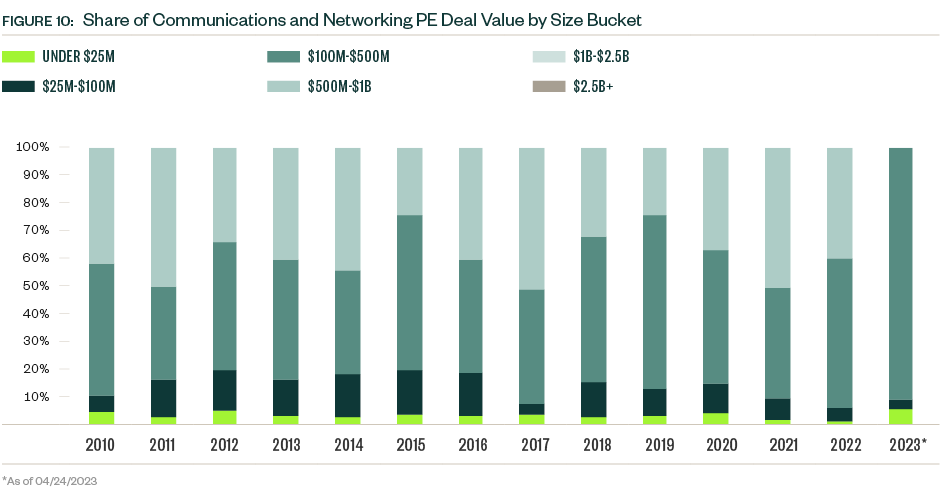
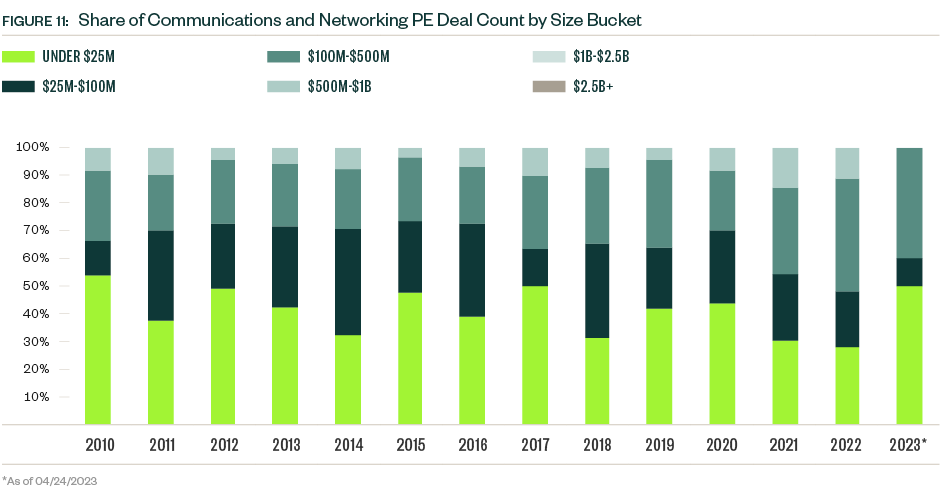
- Deal size growth underscores the stricter capital-raising environment that began in 2022, with investors still willing to write sizable checks for a more select population of companies to reduce risk.
- The exit environment remains difficult across asset classes, with compressed valuations and public market volatility extending beyond the initial hiccups seen in early 2022. Public listings have been the most impacted, but acquisitions and buyouts are also becoming scarcer.
The Market Landscape
M&A: Positive Signals After a Slow Year
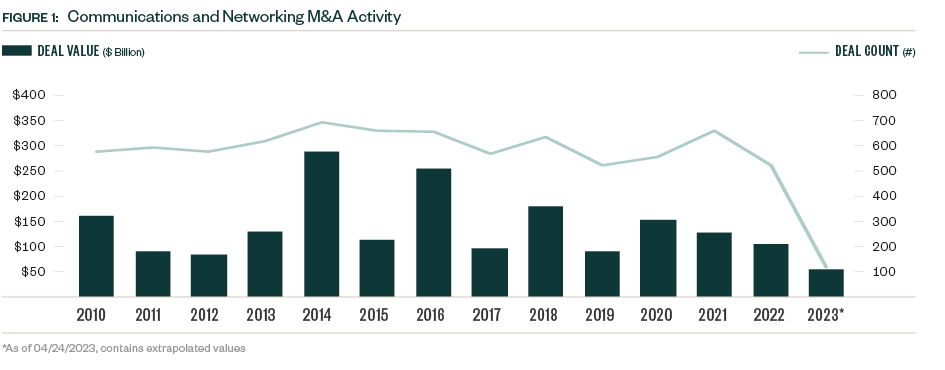

M&A activity including strategic transactions and buyouts historically drives most of the aggregate deal value in the space. M&A deal flow has been relatively steady over the past decade, with a few notable spikes driven by megadeals. Activity proved more subdued in recent years, with deal value declining each year from 2020 onward, a trend exacerbated by the broader market volatility that emerged in 2022. However, signs exist that this string of declines may end.
In the first quarter of 2023 deal value represents more than half of the total closed in 2022. The initial wait-and-see approach that participants took in 2022 in response to uncertainty has waned. Dealmakers are accepting less favorable market conditions as a longer-term reality and now look to execute on deals rather than pass by smaller windows of opportunity.
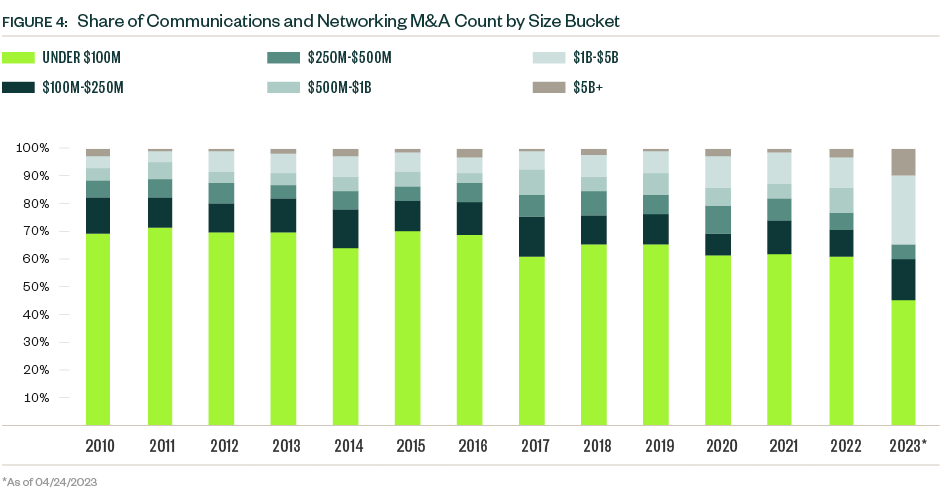
While deal value grew in the first quarter of 2023, quarterly deal count dropped to its lowest point in over a decade, as dealmakers move forward only with their strongest prospects in the current market. Opportunities still exist, but for a more selective population.
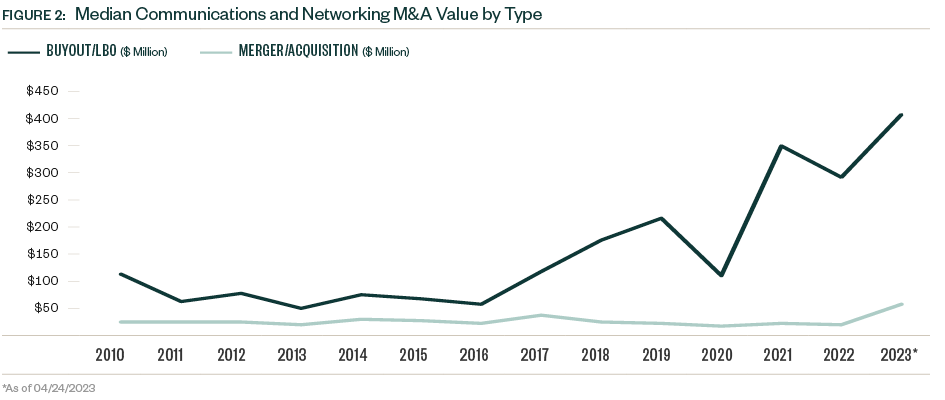
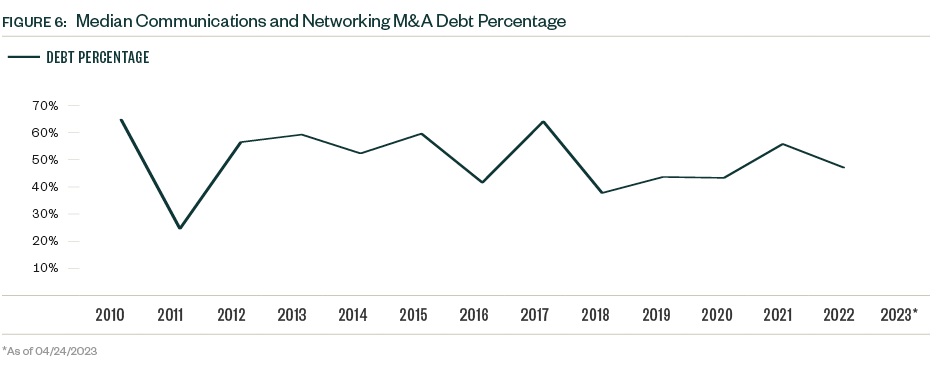
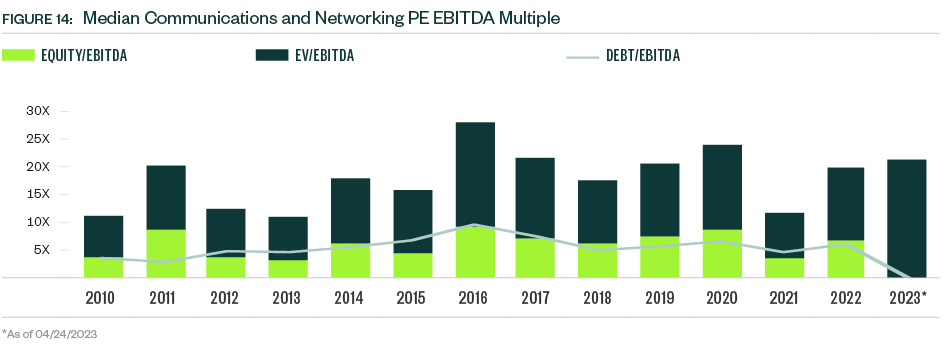
After declines in 2022, this resulted in larger median deal sizes for both buyout/leveraged buyout (LBO) and strategic categories. Deal multiples also dropped in 2022 as high valuations became more difficult to justify, and higher interest rates increased lending costs for dealmakers. The median EV/EBITDA (enterprise value to earnings before interest, taxes, depreciation, and amortization) multiple declined by more than 25% in 2022, and the median debt percentage reduced by over 800 basis points.
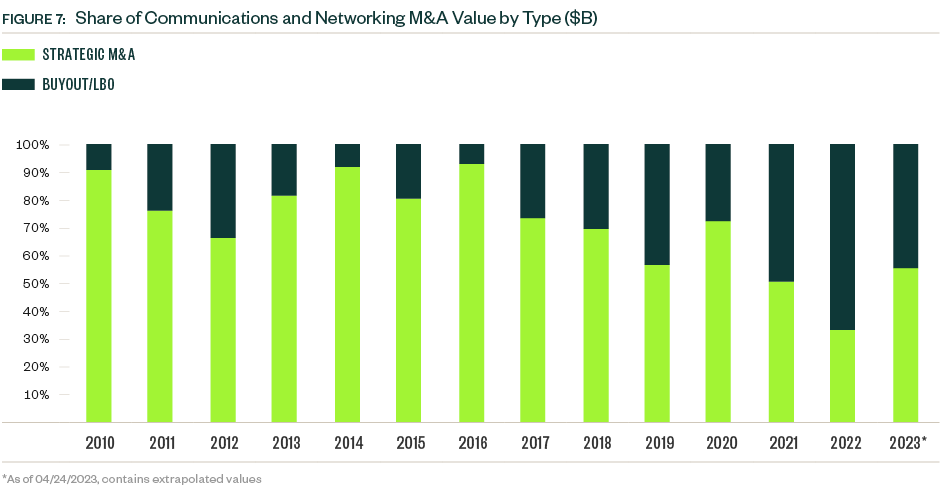
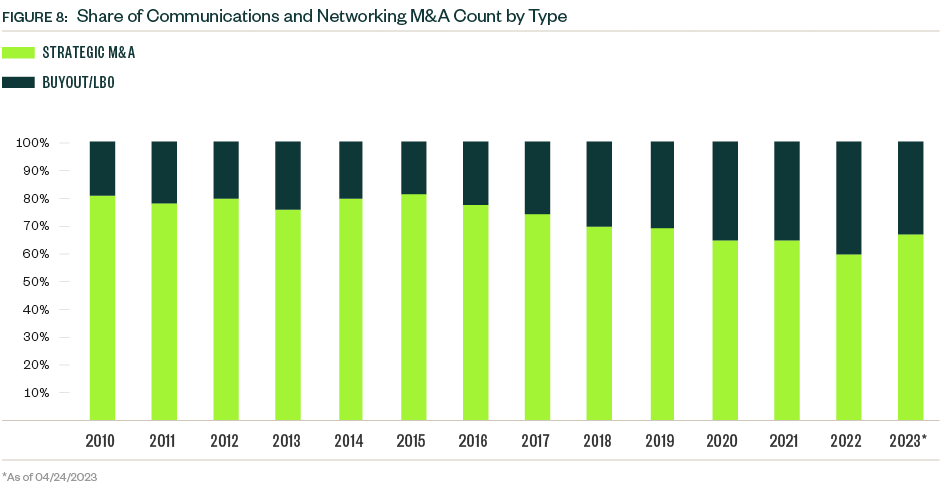
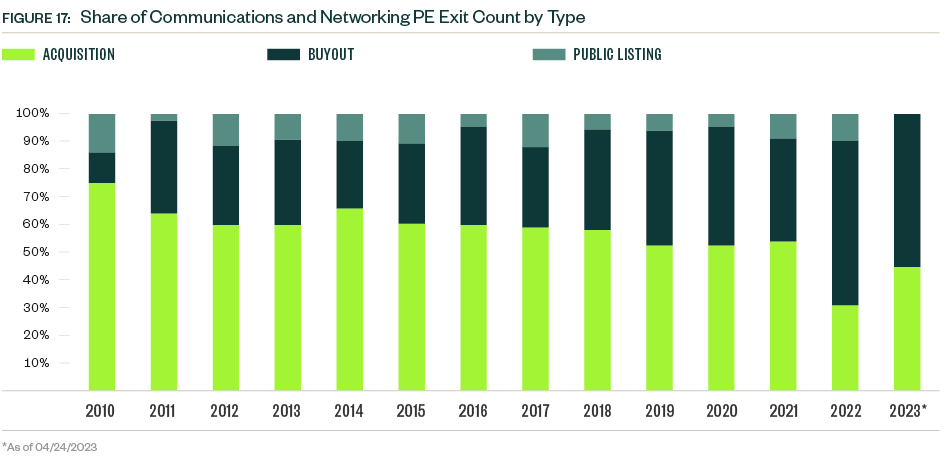
Strategic deals historically represent most deal count and value, though buyouts increased their share of total deal value since 2020. The buyout category also increased its share of deal count to a record 40.5% in 2022, when strategic acquisitions moved to the backburner as budget priorities shifted away from growth prospects to prepare for an economic downturn. Buyouts account for approximately one-third of total deal count and just under 50% of total deal value YTD.
PE Dealmakers Maintain Momentum
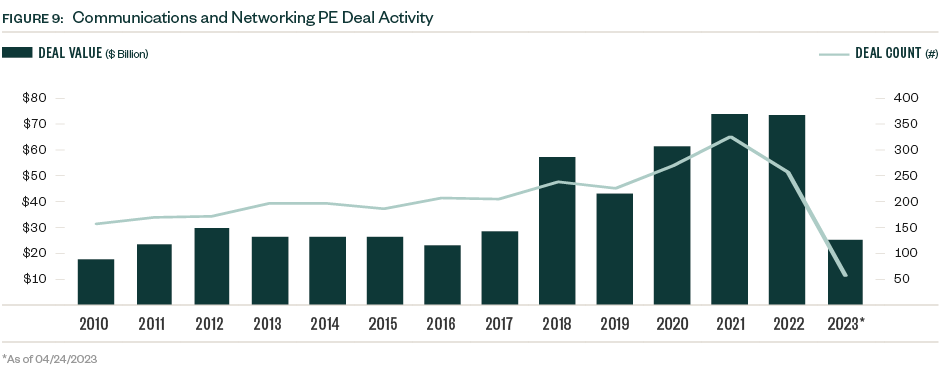
PE activity in the industry proved far more resilient than broader market sentiment would suggest, with total deal value in 2022 coming in just shy of the record high reached in 2021. Fewer deals were completed in 2022, however, indicating that along with M&A, deals are closing for a more selective group of companies.
Following a steady level of activity in each quarter of 2022, deal value rose materially in the first quarter of 2023, reaching the highest quarterly level since Q3 2021 and the second-highest quarterly total on record, according to PitchBook data.
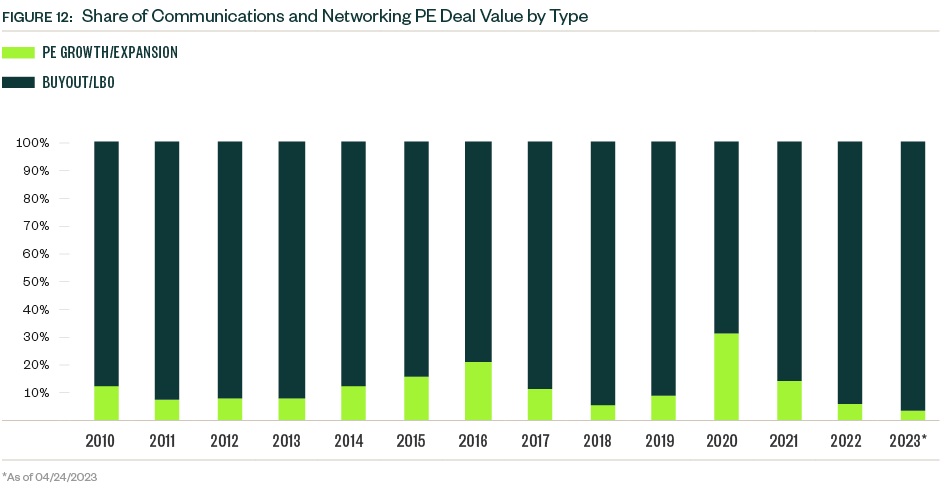
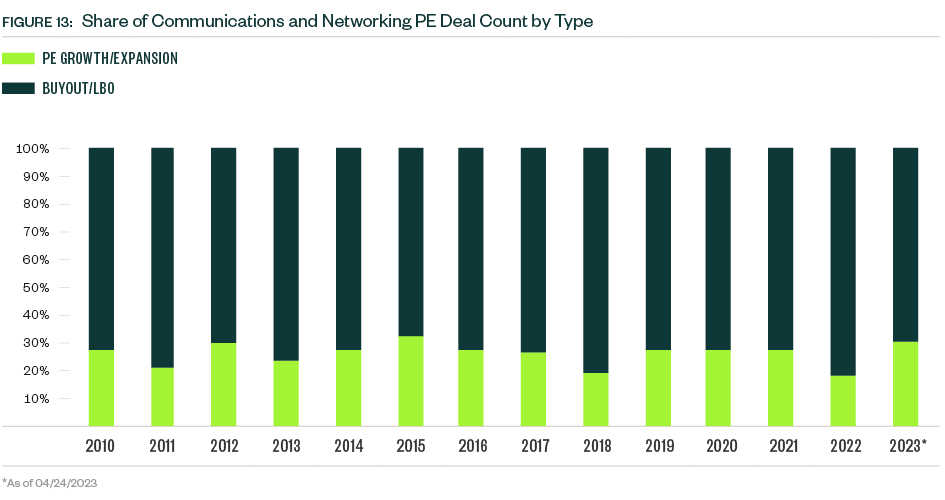
Buyouts and LBOs still represent most of both deal value and count, but growth- and expansion-stage deals represent a larger portion of deal count YTD. Valuations remain compressed, which leaves the window of opportunity for PE firms open, but these minority investments offer an alternative strategy for firms as macroeconomic difficulties persist.
PE firms are strongly positioned in the down market to take advantage of lower target valuations, and this has heightened competition between firms. PE deal multiples rose significantly in 2022 in this environment, including the median EV/EBITDA multiple, which grew 58.0% year over year.
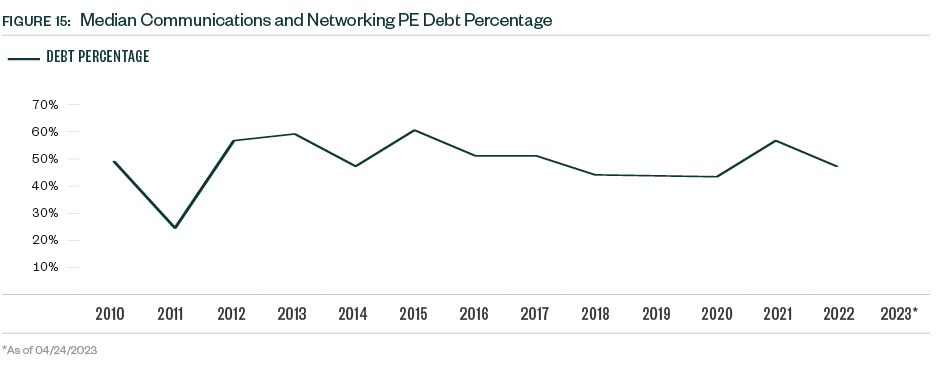
Equity primarily drove this growth, with the median equity/EBITDA multiple notably almost doubling in 2022 despite broader declines in equity values. Interest rates increased the cost of debt associated with deals, and firms looked to decrease exposure. The median debt percentage of PE deals, which declined almost 10% from 2021, illustrates this shift.
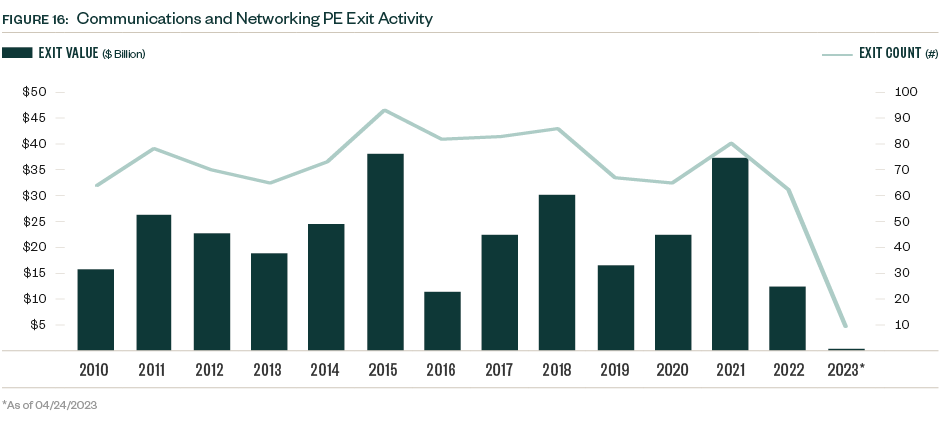
The PE exit environment in the communications and networking industry can be cyclic with several peak and trough years since 2010. A precipitous drop in exit value occurred in 2022, common across industries. So far in 2023, just nine PE exits closed—a number more reminiscent of the small VC presence in the space. Market volatility continues to weigh on valuations, which creates a larger entry pipeline for PE portfolio companies but compounds difficulties down the line for those seeking exits.
Continued VC Investment in Innovation Despite Challenges
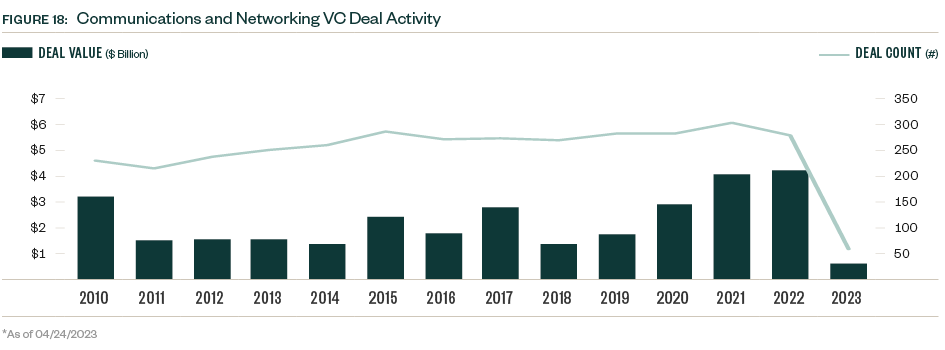
VC remains a small player in the space compared with other asset classes, but activity nonetheless hit a record $4.2 billion in 2022, compared with $4.0 billion in 2021, bucking the downward trend seen in many other industries.
Deal flow declined since then, however, and the first quarter of 2023 closed the lowest quarterly deal value since the second quarter of 2020, when the pandemic-related economic shock began.
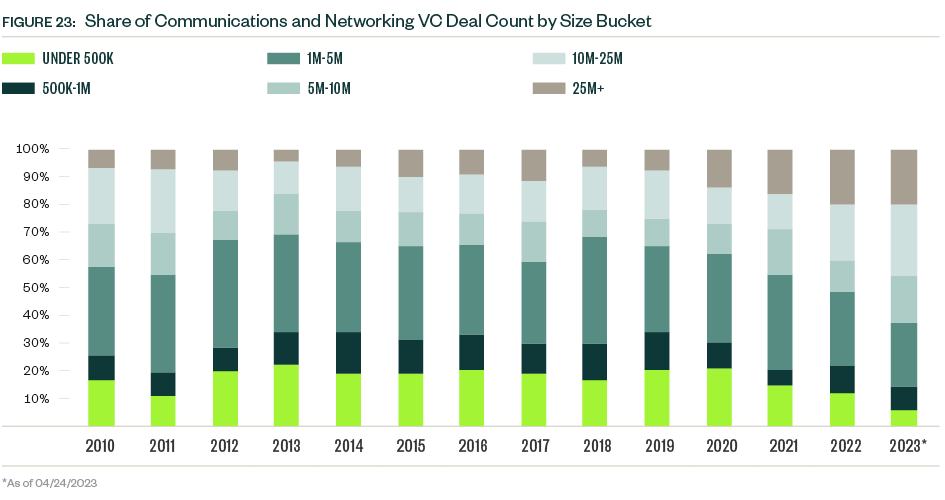
Activity may be off to a slow start in terms of dollar value, but annual venture deal counts held steady over the past decade, and the 57 deals completed YTD indicate a flow of transactions consistent with previous years.
Powerful incumbents and exceptionally high barriers to entry exist for traditional service providers in the industry, but venture-backed companies can drive value through managed services and additive technologies including cybersecurity, Internet of Things (IoT), artificial intelligence (AI) applications, and edge computing.
The bundling of products and services and rising competitive pressures increase the innovation imperative for industry leaders, therefore driving venture investment.
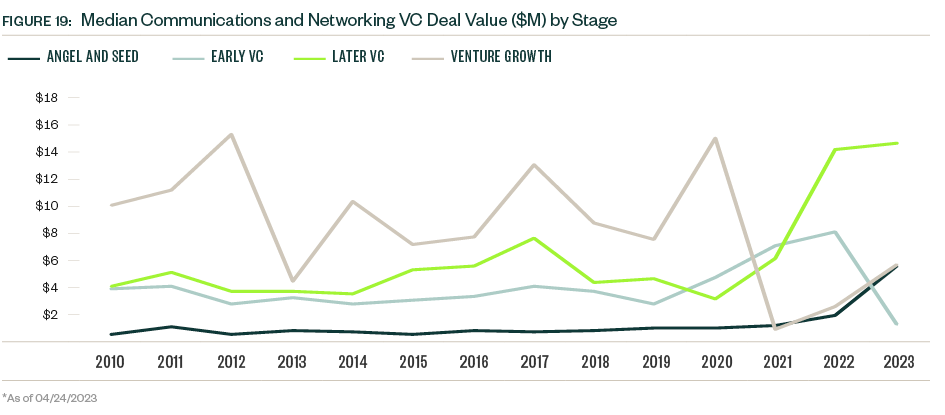
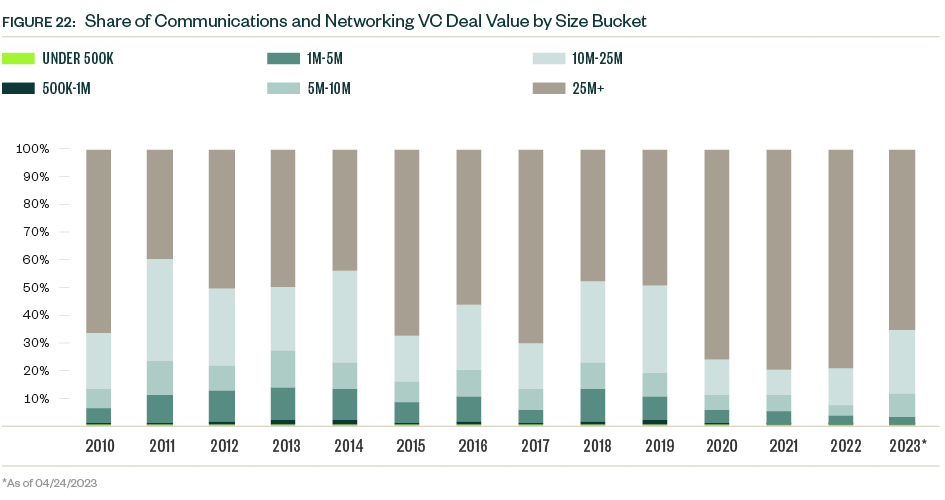
Median deal sizes grew for each stage of venture in 2022 despite the challenging market conditions that emerged during the year. Companies that cleared higher hurdles for funding secured larger check sizes.
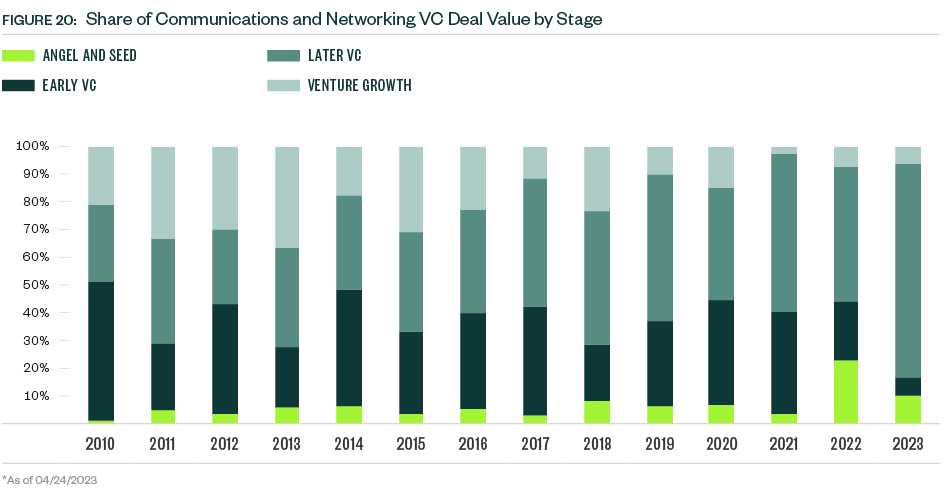
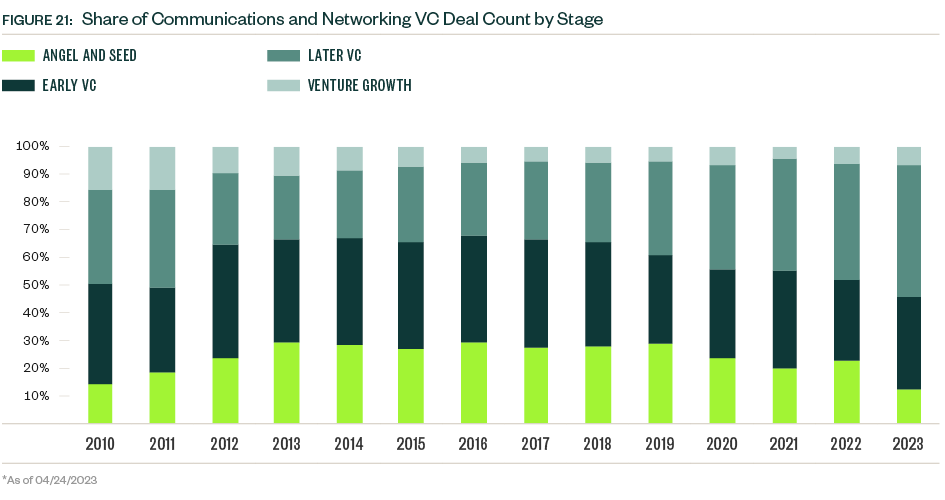
So far in 2023, sample sizes are low, and median deal sizes experienced a mixed bag of changes. The median deal size for early-stage VC dropped, while that of the late-stage VC group plateaued. Late-stage deals dominate the industry’s presence in venture, representing nearly half of the total deal count and more than three-quarters of total deal value YTD.
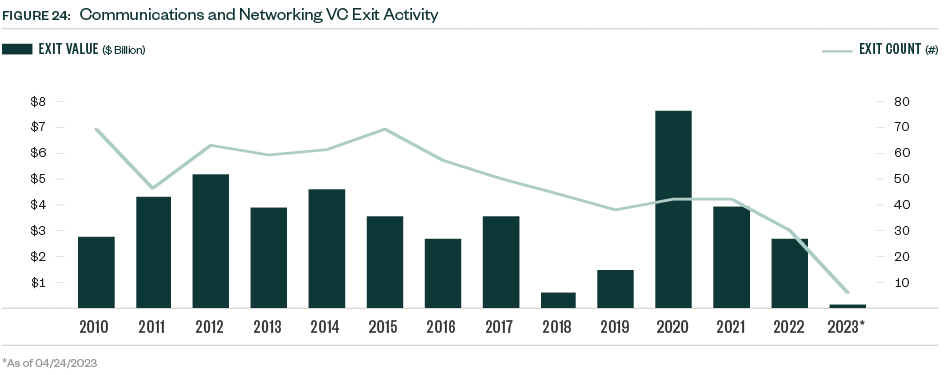
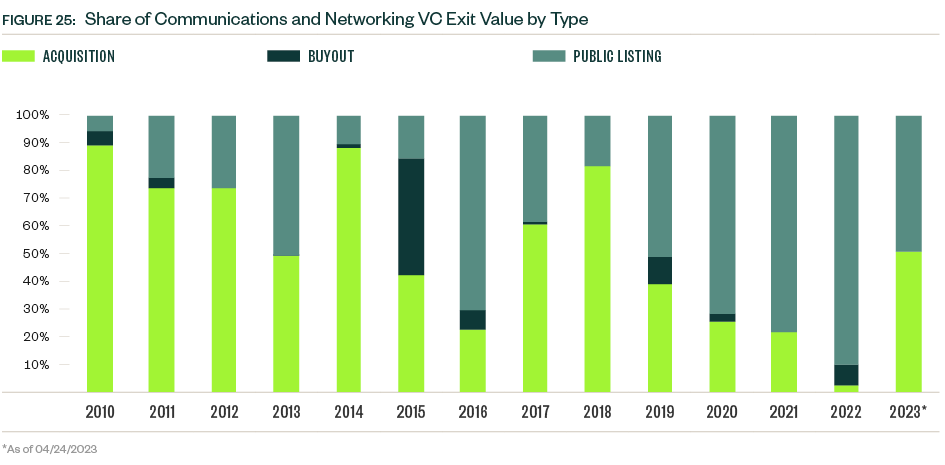
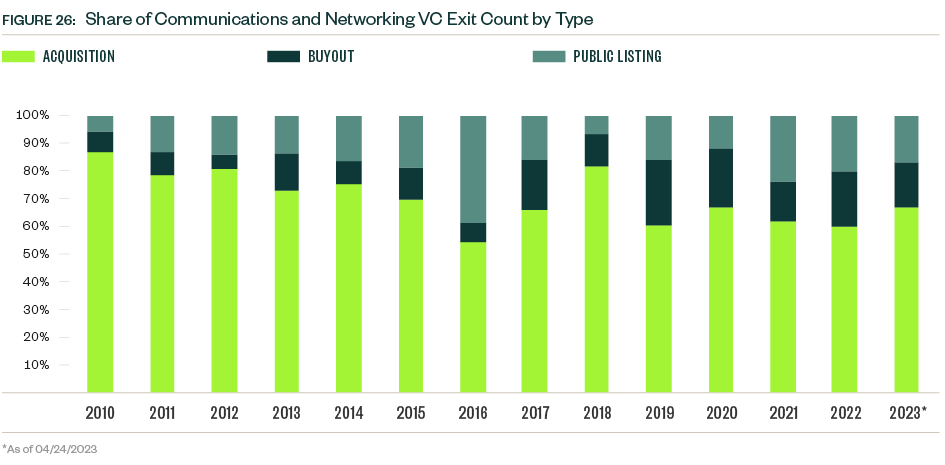
VC exit activity in the space had a record high in 2020 and declined each year since then. Activity YTD reflects continued caution regarding exits, with just one public listing, one buyout, and four acquisitions completed.
The record levels of deal value closed in the past two years will take several years to manifest in exit activity, and compounded macroeconomic stressors continue applying pressure in the near term.
Looking Ahead
Expansive infrastructure needs and innovative technologies bolstered private investment in the communications and networking industry. Market turmoil caused some moderate disruptions in the industry, but increasing use of and reliance on technology, such as broadband, will buoy dealmaking as investors recognize the demand for services.
While difficult to call in a volatile environment, private market activity appears poised for annual growth in 2023 at its current pace, with YTD deal value already more than half that of 2022.
Infrastructure upgrades will remain a priority for governments and investors alike, with expansion of broadband into rural areas and 5G deployment top priorities.
The rise of remote work, growing cybersecurity needs, and increased use of internet-connected devices, for example, open opportunities for innovative venture-backed companies to enter an industry otherwise dominated by a few large players. These incumbents’ need for a competitive edge will contribute to venture and M&A activity in the space, especially with continued consolidation and market expansion.
As the United States enters a presidential election cycle in 2024, focus on regulation will increase. Regulators will closely analyze the performance of current programs, and an administration change could shift their attitudes in an already-uncertain market.
Regulatory risk is nothing new for the industry, however, and the strategic nature of communications technology will continue to be supported by governments worldwide.
Methodology
The scope of tech was defined using a blend of relevant PitchBook verticals as well as the primary industry code of Communications & Networking. M&A deal values were extrapolated. Otherwise, PitchBook’s standard methodologies for report datasets covering M&A, PE, and venture were used. Full details can be found here.
We’re Here to Help
To learn more about the broadband space, contact your Moss Adams professional.