


Inflation impacted nearly every product and service in 2022, with the situation compounded by an economy still facing workforce shortages and supply chain challenges lingering from the previous year.
Rural telecommunications providers certainly weren’t immune to the impact of inflation and workforce shortages as data from Moss Adams 2023 Telecommunications Benchmarking Study demonstrated. Even amidst these challenges, however, local internet service providers, including rural telecommunications carriers, still excelled at providing vital services to their customers.
This year’s benchmarking study provides important data and takeaways influenced by this economic landscape that can empower your business to assess where it ranks against other telecommunications companies in key industry areas. Explore an overview of survey findings below.
2023 Benchmark Methods
The study compiled 2022 data from over 100 companies.
Participants came from 42 states and included a nearly even mix of cooperatives and privately held businesses. Additionally, approximately two-thirds of participating companies were under legacy rate-of-return, with approximately one-third under model-based support—Alternative Connect America Cost Model (ACAM) I, ACAM II, or Alaska Plan.
Participating Companies
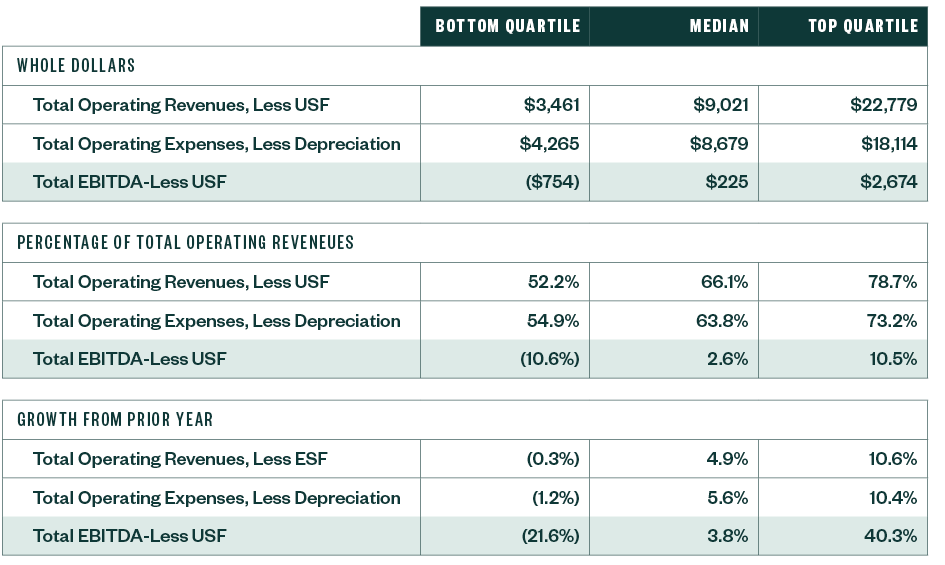
The following table provides a summary of the range of size of the study participants.

The study defines a customer connection as a physical connection that provides service to a residential or business customer.
Often, one customer connection provides multiple services such as voice, internet, and video; however, for the purposes of the study, such instances counted as one connection regardless of the number of services a single customer connection might carry.
This review of the benchmarking data focuses on:
- The impacts of inflation
- Staffing efficiency
- Broadband internet
- Network investment
- Overall profitability
Impacts of Inflation
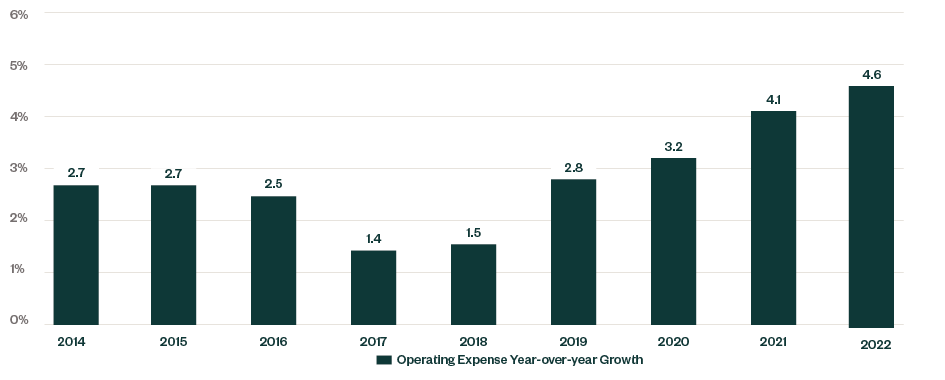
Total operating expenses increased 4.6% from 2021 to 2022. The graph below shows that median operating expense year-over-year growth for the past seven years has steadily increased annually.
Getting more granular, staffing costs have long been the single largest cash expense to rural telecommunications carriers, and are certainly impacted by inflationary factors.
Direct labor costs—gross salaries and wages, employee benefits, payroll taxes, bonuses— historically represented approximately 35% of total expenses and 28% of total revenues. Regardless of the denominator used to same-size a company’s total labor costs, a notable spike of between 3% and 7% occurred, whereas these same figures remained relatively consistent over the previous four years.
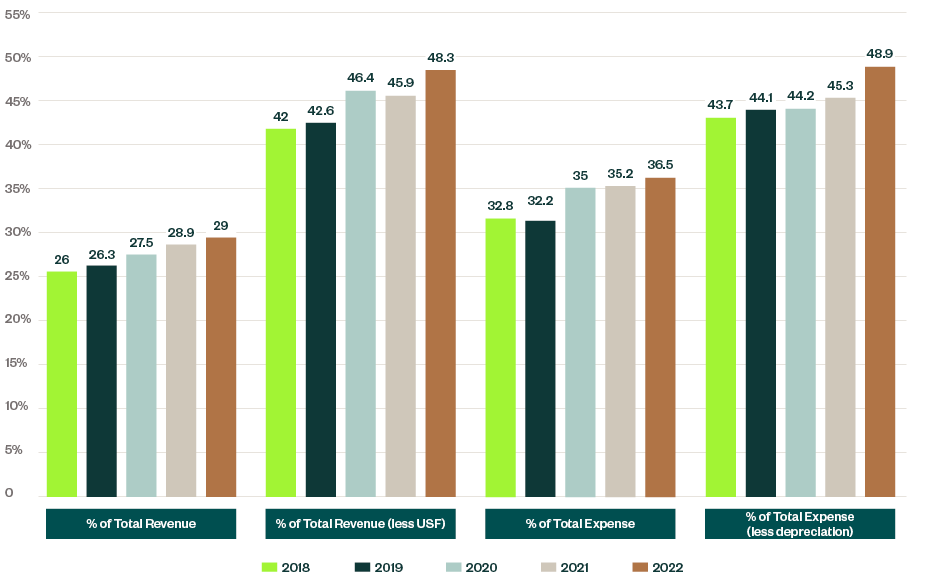
Perhaps most notable is that the median company reports that gross labor costs exceeded 50% of its total operating revenue less Universal Service Funding (USF) —controllable revenues.
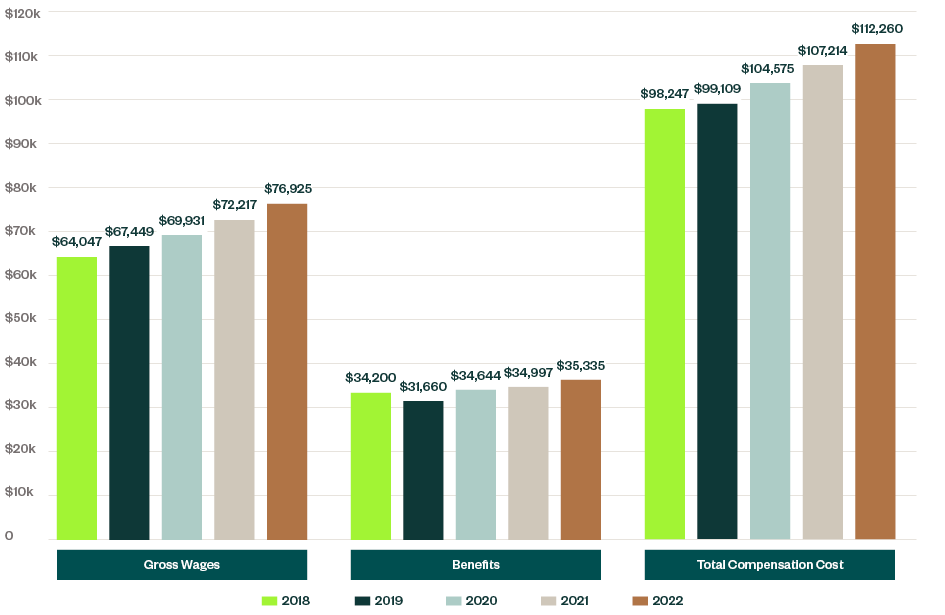
On a more individual level, the increase in personnel costs is more pronounced. Specifically, the average compensation cost per employee increased nearly 6.5% from 2021 to 2022 as compared to only a 3% increase from 2020 to 2021. The following table details the per employee costs for the past five years.
Given these increases in costs, it’s important to ensure the efficient use of staffing resources.
These increases in costs also made their way into the costs of newly constructed or acquired network infrastructure. The median cost per mile of newly constructed fiber assets increased 11.3% from 2021 ($33,604 per mile) to 2022 ($37,392 per mile) and the gross plant per average connection increased markedly as well.
Staffing Efficiency
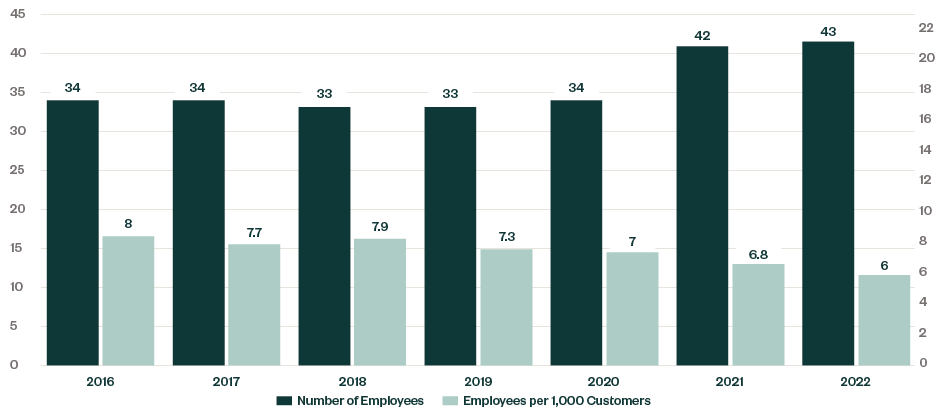
The efficient use of staffing resources is an important management focus. The benchmarking study traditionally used revenue per employee to compare employee efficiency across study participants; however, USF support revenues, and other revenues that aren’t necessarily employee-driven can influence that outcome. As such, this year’s survey introduced a new metric that compares the number of employees to customers—essentially answering the question “How many employees does it take to serve 1,000 customers?”
The graphic below overlays the median number of employees with the number of employees per 1,000 customers throughout the past seven years. As this number dropped from eight employees per 1,000 customers in 2016 to six in 2022, the data appears to support that companies realized some efficiencies in serving customers over the past several years.
Broadband Internet
The availability and reliability of high-speed broadband internet continues to be essential to life in the United States, particularly to people and businesses in rural areas. Retail broadband internet grew to 26% of total operating revenues, up from 14% just five years ago.
Video conferencing continues to be commonplace, and education, work, entertainment, and more continue to rely on robust internet services. Broadband connectivity continues to remove or mitigate barriers to remote working arrangements, remote education, and other opportunities for individuals and businesses to overcome geographic restrictions that previously existed and limited flexibility.
Broadband Growth and Fiber Optics
Circumstances in the rural telecommunications space continue to foster significant customer growth, speed-tier upgrades, and investment in fiber optic network facilities.
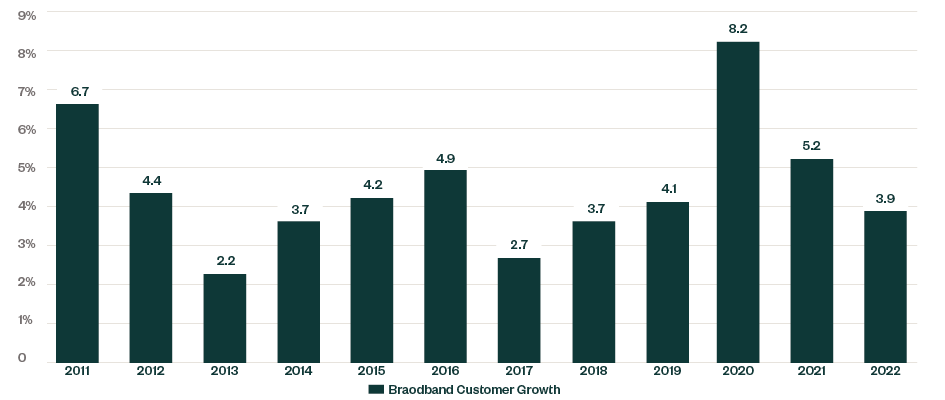
The graph below shows that the pandemic-driven broadband customer growth of 2020 and 2021 hasn’t perpetuated into 2022. The median study participant experienced 3.9% growth in broadband customers from 2021 to 2022. After experiencing the highest two-year customer growth percentage in the more than 10 years since the transition away from dial-up internet to DSL, it appears growth rates returned to pre-pandemic levels.
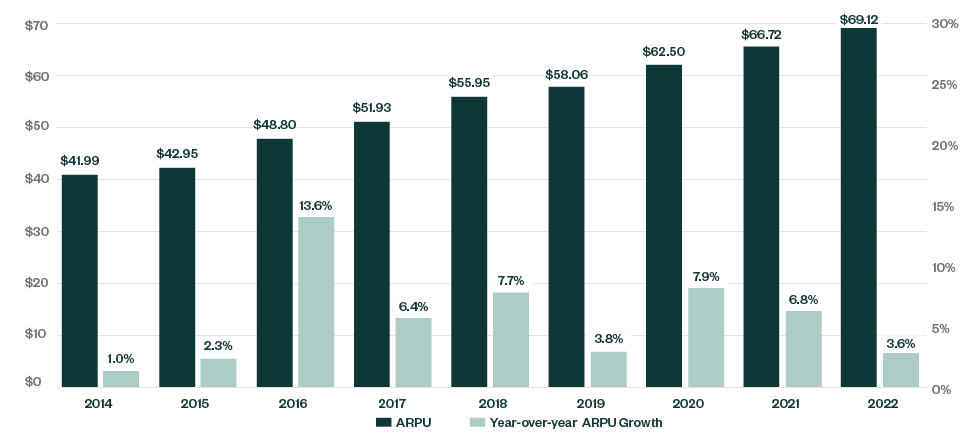
During and shortly after the pandemic, along with the added customers detailed above, existing customers upgraded services to higher speed broadband packages. This is partially evidenced by the increase in broadband customer average revenue per user (ARPU) from $58.06 in 2019 to $62.59 in 2020 (a 7.9% increase) as well as the following year increase to $66.72 in 2021 to $66.72 in 2021 (a 6.8% increase). However, the 3.6% growth in ARPU in 2022 reflects some stabilization in average pricing.
A more detailed look into the customer densities across various broadband speed-tier packages shows a movement to broadband products that provide a download speed between 100Mps and 500Mps.

Continued deployment of fiber optic network facilities made this growth possible—see more on network expansion below. The median company reported that 79% of its residential customers had fiber connections to the premises.
This expansion of fiber to the premises not only allows for increased download speeds, but also increased upload speeds—essential for quality video conferencing performance, gaming, and other activities.
Specific to the number of speed-tier service combinations offered by companies to customers, the median company reported offering ten combinations, with over 75% of all companies reporting three to 11 offerings.
The most common service package customers subscribed to in 2022 was a symmetrical 100Mbps service, totaling 14% of all broadband customer subscriptions. Other common service packages were 25Mbps download/3Mbps upload at 9% and 100Mbsp download/10Mbps upload at 11%.
Voice Data vs. Broadband Only
Another continuing significant trend in the rural telecommunications industry shows movement away from selling broadband internet packaged with a phone line, or voice data, to selling broadband as a stand-alone service, or broadband-only.
In total, broadband-only customers in the benchmark study totaled approximately 41.5% of all broadband customers. This indicated a 7% rise from the prior year.
Comparing legacy rate-of-return carriers to elected model-based support—ACAM I, ACAM II, or Alaska Plan—further illustrates the trend. This is a logical result due to the added support that legacy rate-of-return carriers receive for broadband-only customers, whereas model-based support carriers receive no additional support while losing the local revenue. There is, therefore, less incentive for model-based support carriers to offer broadband-only services.
The median legacy rate-of-return carrier reported 49.6% of its broadband customers as broadband-only compared to 37.4% reported by carriers under model-based support.
Network Investment
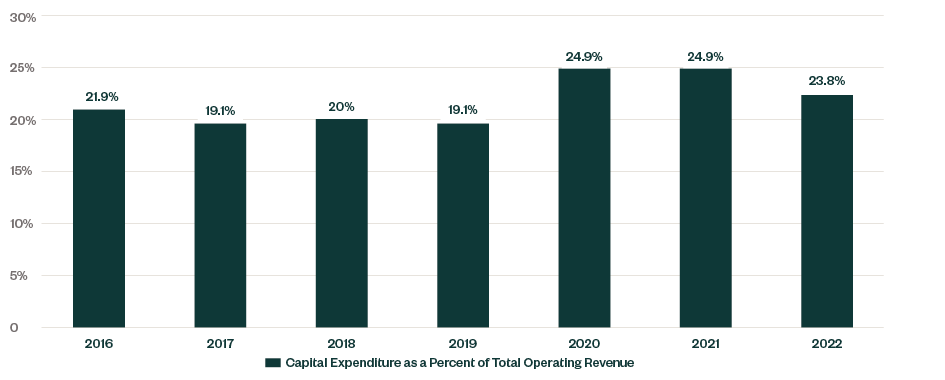
Rural telecommunications is capital intensive. The median company reported the per connection gross network investment at $10,912. Companies continue to deploy fiber to the premises throughout their networks, however, not at the same levels in 2020 and 2021—which saw an increase in network spending compared to previous years.
The graph below presents the median of network investment as a percentage of total company revenues.
Capital investment will likely be greatly impacted in the next few years by federal funding made available under the Infrastructure Investment and Jobs Act and other infrastructure funding programs.
Future benchmarking studies will include metrics to measure this unique network capital source to compare internally funded expansion activities to externally funded expansion.
Profitability
Even after inflation challenges, the industry again experienced strong profitability results in 2022; albeit slightly down in earnings before interest taxes depreciation and amortization (EBITDA).
Over 3% growth in total operating margins, fueled by an 8.8% growth in broadband internet revenues, bolstered profitability while maintaining 2021 levels of federal USF. Specific to USF, interest continues to be high in evaluating a company’s profitability excluding federal and state universal service support—EBITDA-less USF or controllable margins.
Companies want to prepare for a future with less or no USF given the persistence of caps on federal USF, such as budget control mechanisms, per line caps on support, expense limitations, changes to the programs, and other constraints.
The graphic below shows the median company’s profitability figures along with EBITDA-less USF for the past five years.
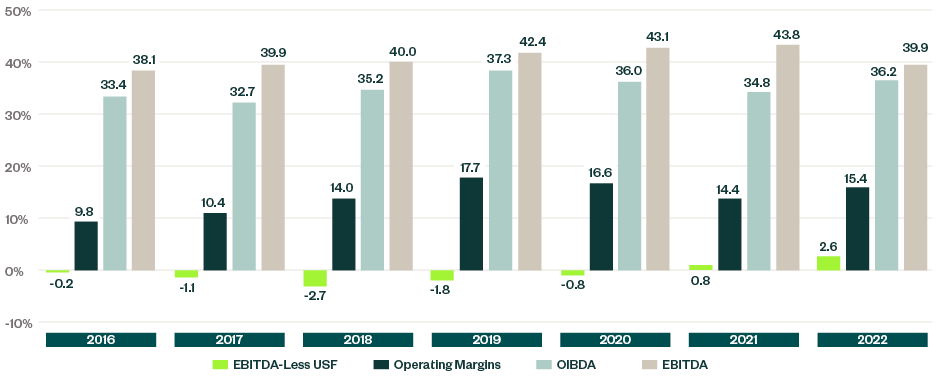
As noted above, the median company continued to report a positive EBITDA-Less USF after having reported a positive figure for the first time in 2021.
This continued improvement in EBITDA-less USF is a function of the focus companies have placed on growing their services beyond the legacy wireline services.
We’re Here to Help
For more insights on how your company can navigate the current telecommunications landscape, contact your Moss Adams professional.