


After high performance in dealmaking in 2021 and 2022, detailed analysis in macro dealmaking shows that the technology sector is experiencing some cooling in private equity (PE), M&A, venture capital (VC), and other market trends.
While high interest rates are affecting deals and the related debt versus equity ratios involved with them, the economy has been more buoyant than expected, and growth deals have remained an active part of the market. M&A activity overall has slowed, but strong cash reserves and balance sheets indicate promise for the foreseeable future and could represent a way for entities to find growth at a discount if valuations continue to stall.
Explore additional reporting on market conditions and transaction trends in our 2022 report, Technology Landscape Macrotrends: Industry Response to Market Turmoil.
Highlights
PE
PE activity in the technology sector rocketed upward in 2021. Deal value barely wavered from that record high in 2022, as discounted valuations offered attractive discounts for firms. Year to date (YTD), PE activity has slowed, with $129.2 billion in total value, representing less than one third of 2022's total.
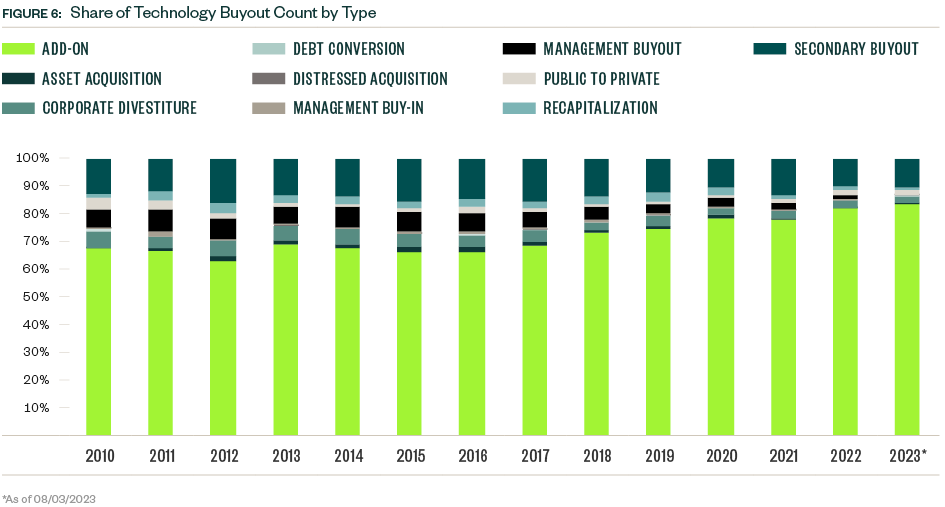
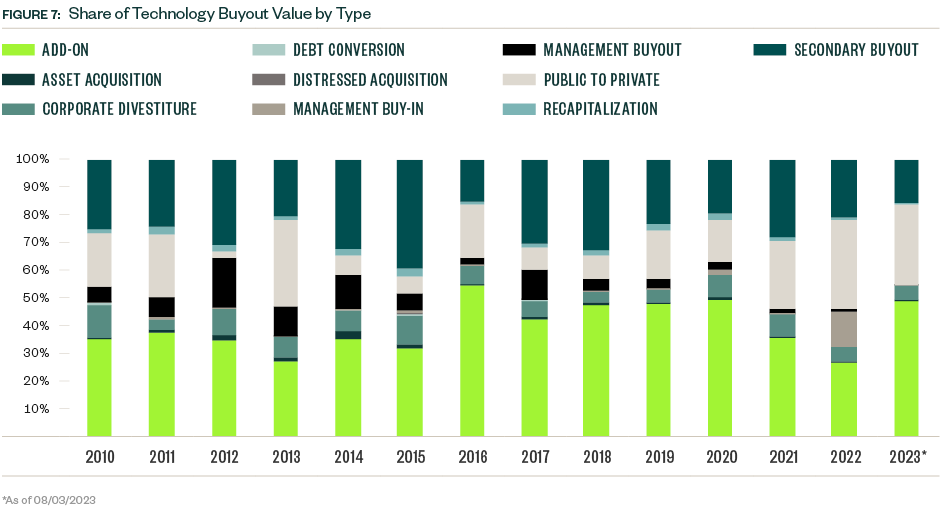
Mounting pressure from the highest interest rates in decades softened the industry's appetite for buyouts, but add-ons and public-to-private deals remain popular strategies and account for nearly 80% of total buyout deal value YTD, compared with 58.8% in 2022. We believe deal sponsors are also dealing with the distractions of lower-than-expected existing portfolio company growth and performance due to negative macroeconomic impacts.
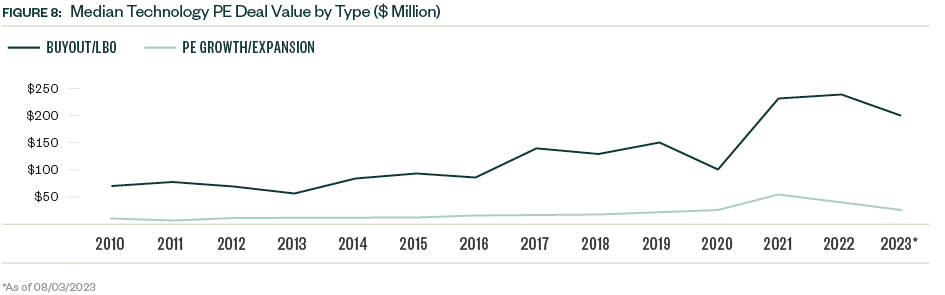
Median deal sizes have declined YTD by 15.1% for buyouts or leveraged buyouts (LBOs) and 28.6% for PE growth or expansion deals.
M&A
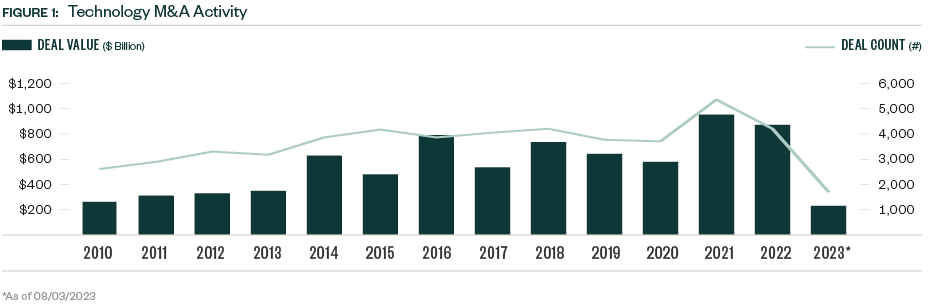
Technology sector M&A activity has slowed more prominently YTD, reaching $234.9 billion, when compared with $881 billion in 2022. Deal value declined in both quarters this year.
Sample sizes are low, but the median debt percentage for deals has declined from 49.7% in 2022 to 33.5% YTD, indicating that players are closing deals with more equity at stake due to higher lending costs and lower risk tolerance, namely leverage, from debt underwriters.
VC
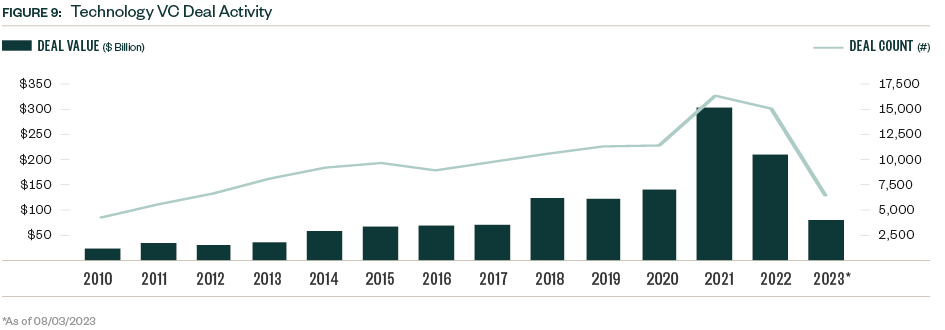
Total deal value declined from a record high of $302.5 billion in 2021 to $210.3 billion in 2022 but maintained some momentum, with 2022 representing the second-highest year on record by a healthy margin.
YTD activity reached $81.6 billion, indicating a further slowdown in activity. However, deal value in the first half of this year exceeded the amount closed in the second half of 2022, as investors look to deploy capital more readily after waiting out initial recession concerns.
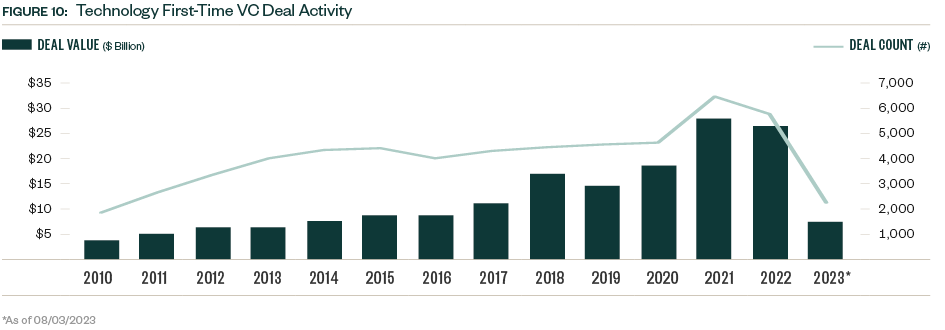
First-time-technology VC-deal activity maintained momentum in 2022 despite a broader VC slowdown and volatility in technology stocks. Deal flow has slowed since then, with YTD value representing less than one third of 2022's total.
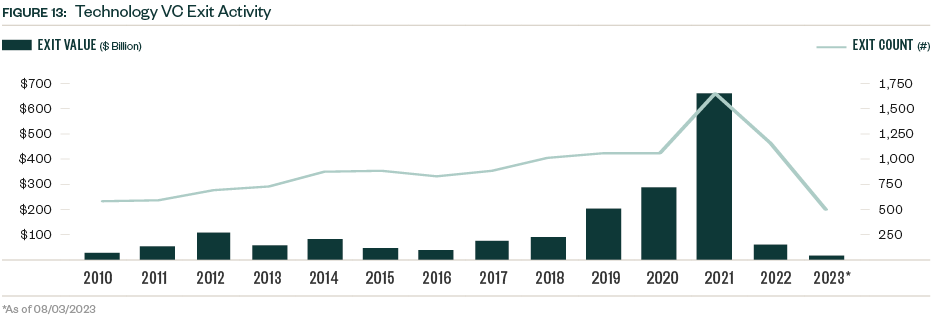
Late stage deals for slow growth or limited visibility to free-cash flow continue to be a difficult space for VC funding in 2023. Technology VC exit activity remains low, with just $20.1 billion closed YTD after a steep descent between 2021 and 2022.
Macro Trends
Primary factors for the technology ecosystem this year remain varied and complex.
Unexpectedly Resilient Economic Growth
Although multiple market and macroeconomic indicators, such as manufacturing activity indexes and productivity analyses still indicate a recession, the United States has recorded only positive economic growth, albeit at smaller rates.
Concerns around the challenged commercial real estate market and a housing slowdown as mortgage interest rates climb relentlessly still prompt some observers to anticipate ripple effects. As major technology companies still power public market performance almost singlehandedly, the sector could be better positioned.
Challenges and Opportunities in a Volatile Labor Market
The difficulty of proving the efficacy of various working models—remote, hybrid, and onsite being the major triad—will likely contribute to choppiness in the labor market going forward. This will prove beneficial to some technology companies as they court remote talent with such models, as opposed to competing on pure salary bases with larger competitors.
Counterbalancing, larger firms that are handling existing long-term office leases may opt to compete once again in traditional modes but increase wages.
Geopolitical Tension Impacts on Business Prospects
Although concerns around outright conflict are likely overblown, the degree of restrictions placed on businesses engaging in commercial activities abroad in some major markets are onerous to nonnegotiable. As a result, growth in other emerging economies will likely continue, as well as significant focus on domestic expansion wherever possible.
Market Trends
M&A Activity Slowdown
M&A activity in the US technology sector is very slow, with 1,735 completed transactions as of early August 2023. Aggregate deal value stood at $234.9 billion across the same time frame, putting 2023 on pace to resemble the early 2010s in terms of overall tallies. Quarterly figures show a gradual yet inexorable decline in dealmaking volume.
This decline is explained by multiple factors which mostly look stable for the foreseeable future. Financing costs overall have risen due to monetary policy contractions, whether by raising interest rates or alternate means by central banks worldwide, but particularly in the United States. Rate hikes also have the eventual, practical effect of increasing the cost of capital deployment, thereby in effect raising the hurdle rate for target returns for multiple endeavors, including M&A.
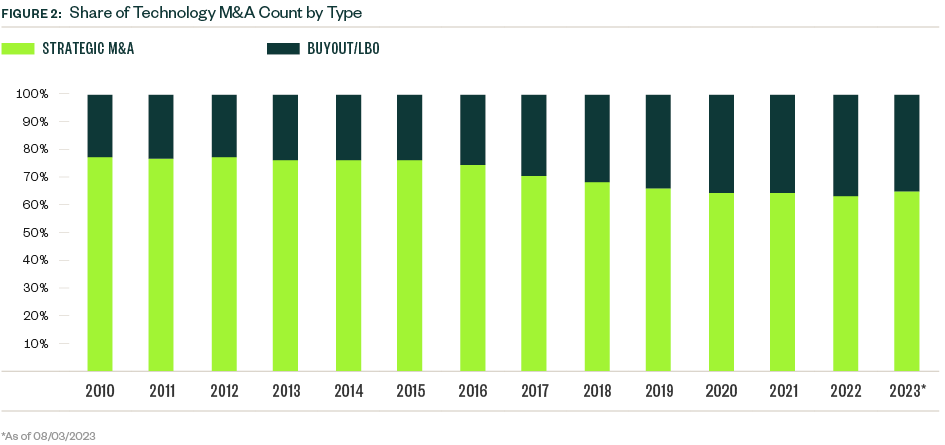
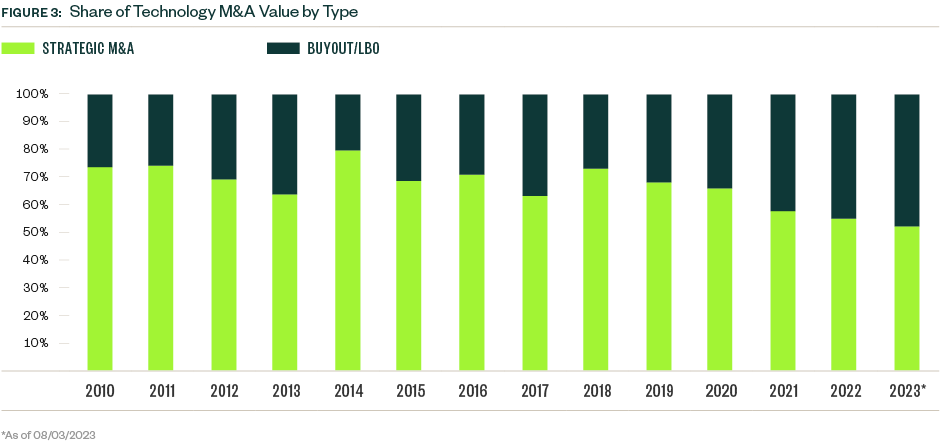
As market valuations have been pressured by such factors for some time now, dealmaking has endured as some businesses have become relatively more attractively priced. The proportion of PE activity as overall M&A value hasn’t been so strong in well over a decade, standing at $112.4 billion YTD. Although the number of strategic or nonfinancial M&A remains high PE buyers have seized on targets in the current climate, that’ s likely thanks in part to their specific financial and timeline motivations.
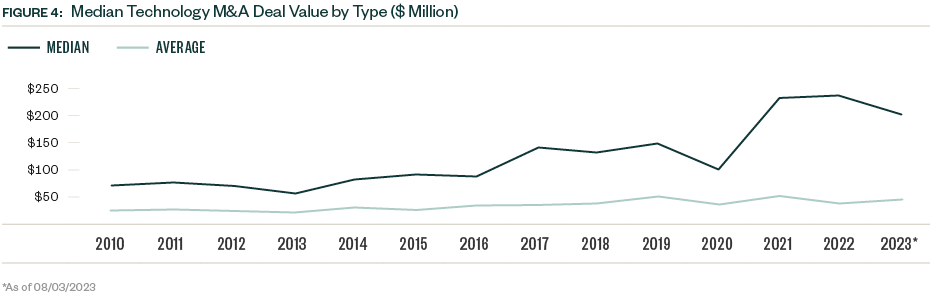
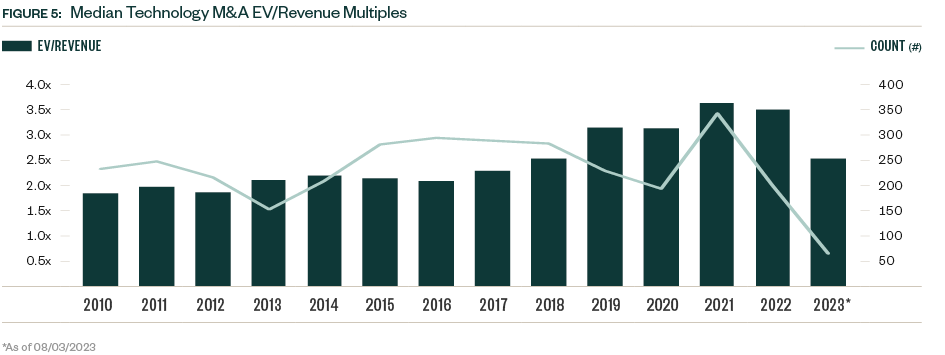
Enterprise or revenue multiples remain relatively resilient compared to historical tallies. The median buyout size remains quite elevated, at $200.0 million, while the median M&A transaction value stands at $43.0 million in 2023 YTD—the third highest tally on record and even exceeding 2022 or 2020. As PE dry powder remains at a near-record level, multiple corporates have better-positioned balance sheets, and cash reserves are strong, the means with which to strike deals are intact, so only the necessary rationales for acquisition and subsequent processes have grown more challenging.
Hence the popularity of add-ons in the PE space, as they now account for approximately 80% of all buyouts done so far this year, after an inexorable rise throughout the 2010s. They’re popular for many reasons, such as more justifiable entry multiples due to anticipated blending of costs by numerous entity acquisitions; and often smaller target sizes, so lesser leverage required, for example, but their popularity is also emblematic of the current environment, in which financing costs and uncertain macroeconomic growth prospects are urging caution. For the right technology business, usually software PE firms are still more than willing to pay a premium, with the median buyout still at $200.0 million and even the minority growth capital infusion figure at $25.0 million.
At earlier stages in company lifecycles, among the venture ecosystem, those hurdles are only higher despite a similar near-record level of capital overhang ready for disbursement. After a peak in 2021, the aggregate deal value slumped in 2022 as volatility surged and the exit market froze, leading to a much slower rate of venture investment thus far this year. At 6,539 completed deals so far in 2023 as of early August, this year may be on pace to record a tally more akin to those seen from 2018 to 2020. Aggregate VC invested is following suit.
Venture Financing
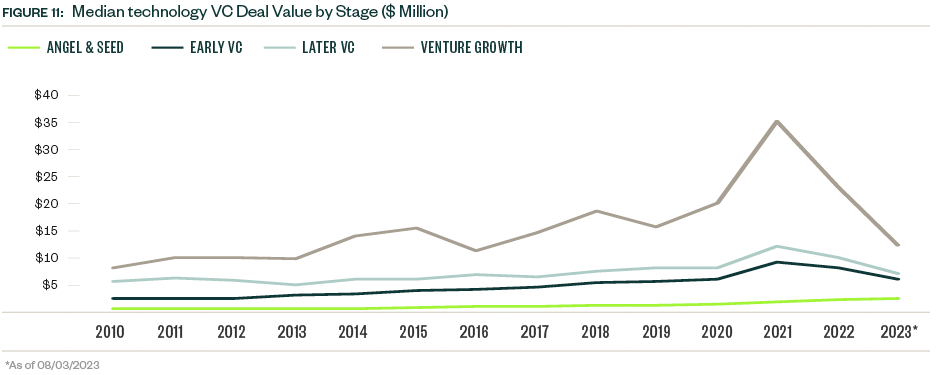
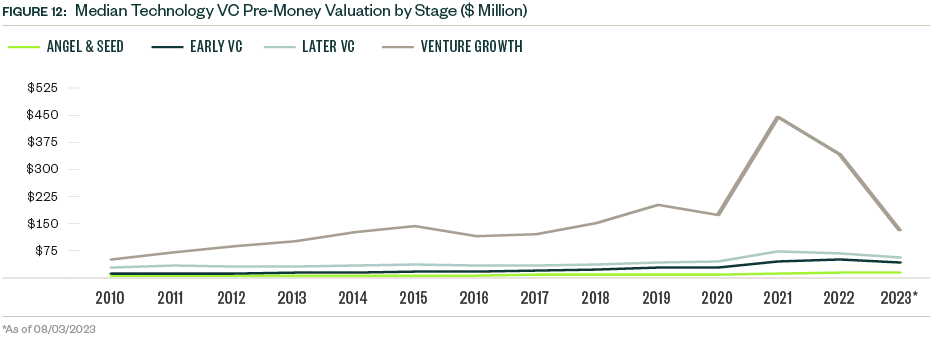
First time venture financing is slowing as well—though at a more sedate pace. In terms of financing metrics, those trends align with the fact that median deal sizes have not diminished overly apart from the venture-growth stage, and even then, only to levels observed prior to the boom period from mid-2020 to mid-2022approximately. Valuations are tracking similarly.
Across the VC space, much slowing can be explained by the sluggishness of exit activity. From lofty peaks of multiple listings and billions of dollars in exit value accrued in 2021, exit volume plunged in 2022 and is on track to stop short of 1,000 completed liquidity events in 2023.
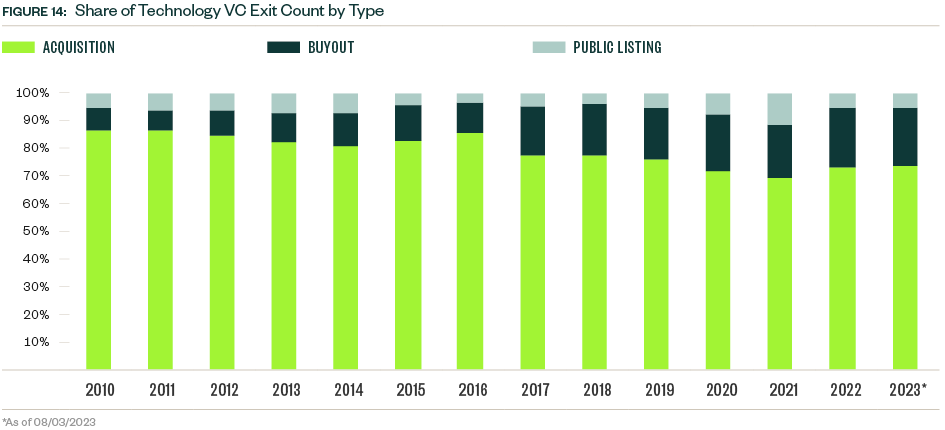
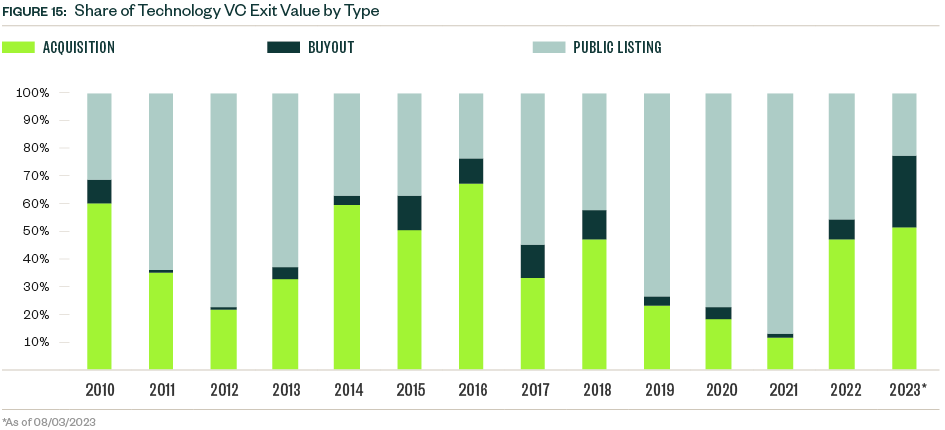
Aggregate quarterly exit values haven’t been this weak since before 2018. The bulk of this decline is explained by the dearth of public listings, both in terms of capital raised in such debuts, and their incidence, with fewer than 30 YTD by venture-backed businesses. Acquisitions are still proceeding, as are buyouts, but in lower volume.
Exit sizes have also mostly returned to pre-2018 levels. As a result, the types of rich late-stage valuations seen much more frequently are that much harder to justify given current and even semi-protracted liquidity prospects. The initial public offering (IPO) market could be thawing. There’s the potential for more debuts later in 2023, but market players remain under observation.
Facts and Figures
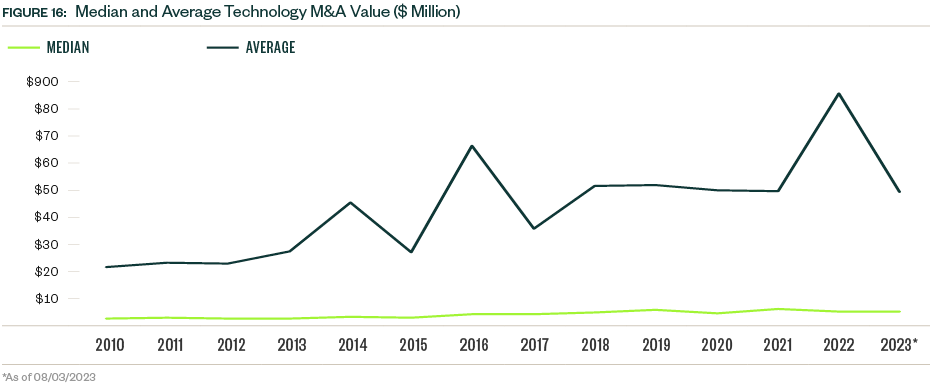
The median M&A deal size in technology in the United States kept pace with 2022 YTD at $52.5 million. That value was on the higher end historically, which, in tandem with the relatively strong average figure of $490 million suggests that demand for well-positioned, high-quality businesses remains strong. However, outlier deals are occurring less frequently due to financing costs, murky economic forecasts, and less-certain growth prospects.
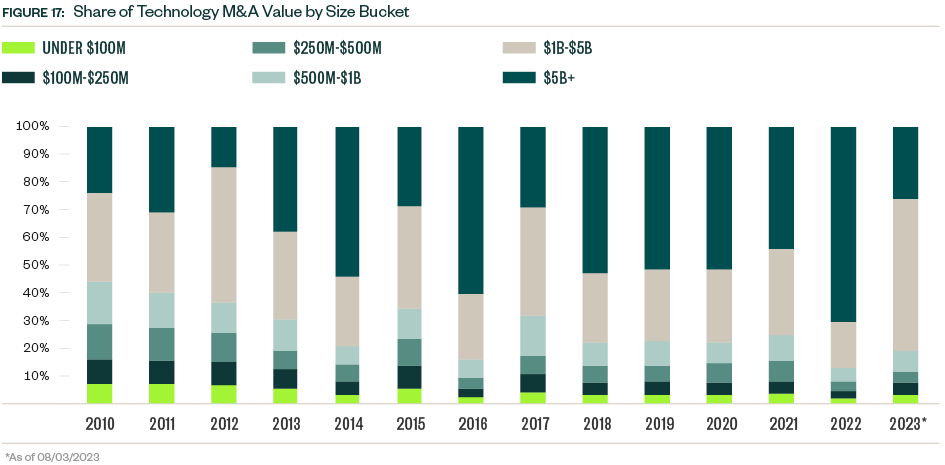
The proportion of M&A between $1 billion–$5 billion hasn’t been this high in over a decade—looking at either count or aggregate deal value. Although M&A is down, there’s still sufficient appetite for deals and enough resources that large deals are being struck, but the previous outlier, richly priced transactions at the very upper end of the market, are occurring less often.
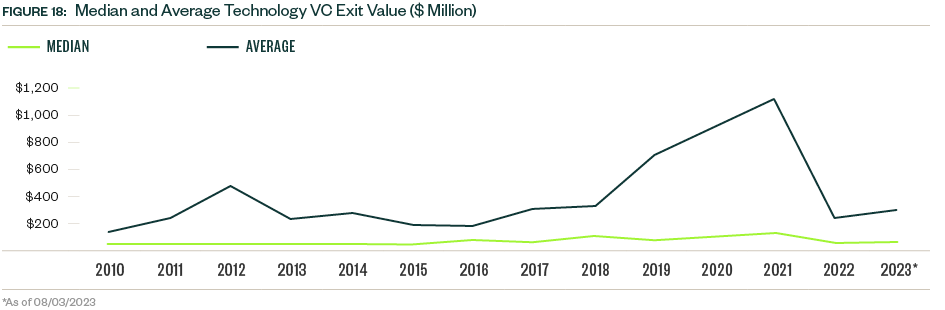
Given the volatility of the past 18 months in both the public and private markets, the sudden steep decline in average venture-backed exit sizes in technology was to be anticipated. The median also declined in 2023 YTD, indicating weak demand for emerging companies, though the tallies are higher than in the early 2010s.

The median amount of venture capital raised prior to exiting has declined again year over year, suggesting that acquirers are sourcing more widely across early-stage start-ups and also that the days of high-flying financing sizes and valuations are leveling out.
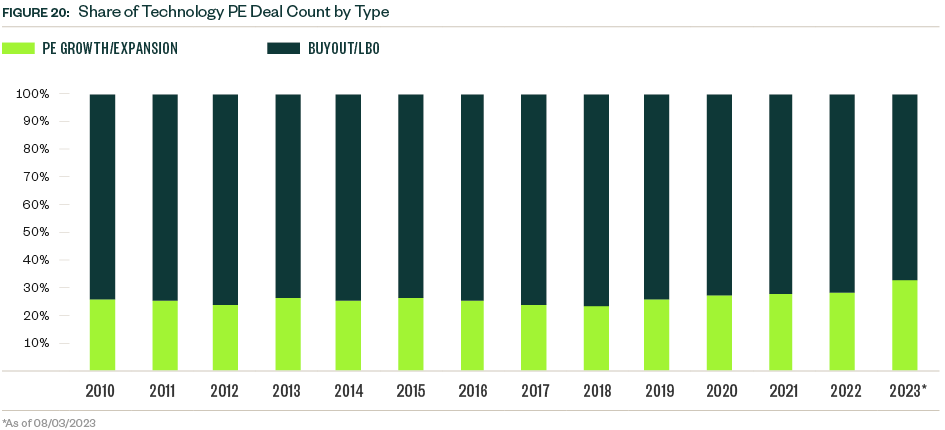
The proportion of PE growth deals in technology has surged in 2023 YTD, suggesting that general partners are still eager to deploy capital, just in more moderately sized and cautious manners.
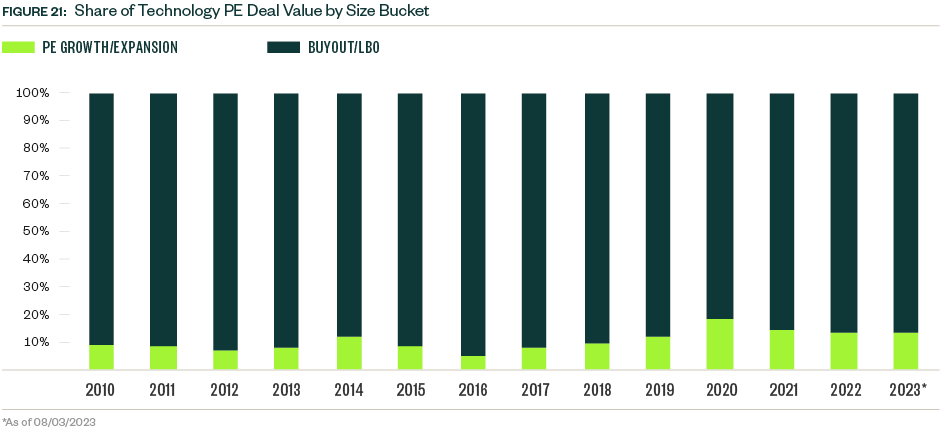
Large buyouts have retreated significantly in terms of relative proportion of deal value, with just six so far this year at $2.5 billion or more, relative to 28 in 2021 and 27 in 2022.
Methodology
For venture datasets, PitchBook’s custom technology definition (any technology verticals utilized by PitchBook) was used. For PE and M&A datasets, the primary industry code of Information Technology was utilized, meaning that any underlying company had to have that industry code marked as their primary. M&A values were extrapolated. Otherwise, PitchBook’s standard methodologies for report datasets covering M&A, PE, and venture were used. Full details can be found here.
We’re Here to Help
For more information about dealmaking in the technology sector, please contact your Moss Adams professional.